The yield curve is a graph which plots time (from shortest to longest maturity date) on the horizontal access, and yield on the vertical access. It is used to show the relationship between yield and maturity.
Yield curves work best when plotting different maturity dates for the same type of bond, meaning that the only major difference in the securities is their maturity date. For example, a yield curve could plot maturities and the corresponding yields for treasury bonds, corporate bonds with high credit ratings, municipal bonds from a particular state, or any other type of bond.
By comparing the yields of bonds that are similar, but with differing maturities, we can generate a graph which shows how yields change as the maturity date lengthens. (see examples below)
On the horizontal axis of the yield curve we have the time to maturity going from 6 months to 30 years. On the yield curve’s Y axis, we have the yield to maturity going from 0 to as high a percentage as needed to incorporate the yields of all the maturities plotted.
The Yield Curve Types
The Normal Yield Curve
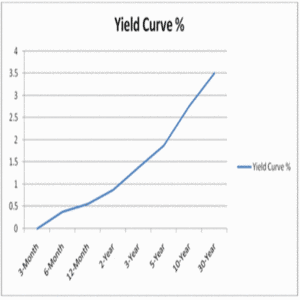
Normally the yield curve is upward sloping showing that, all else being equal, a bond with a longer maturity pays a higher yield than the same bond with a shorter maturity. From the great depression through to today, the yield curve has spent the majority of its time in the shape of a normal upward sloping curve.
Why is this the normal situation? Generally speaking, individuals and institutions prefer to lend money for shorter periods of time, rather than longer periods of time. The risk that the lender will need the funds, or the borrower will be unable to pay, increases with time. Another way of saying this is that the longer the term of the loan or bond, the greater the chance something unexpected will happen. To compensate for the extra risks associated with lending money for longer periods of time, lenders generally demand a higher rate of interest.
The Steep Yield Curve
When investors are expecting interest rates to rise in the future, it makes sense that they are going to demand a higher rate of return when buying longer term bonds. If longer term bonds did not pay a higher rate of interest in this situation, investors would simply buy shorter term bonds, with the expectation that when the bonds mature, they would be able obtain a higher return on the next purchase. Often times, when the economy is coming out of a recession, future interest rate expectations will increase. This is because economic recoveries are normally accompanied by corporations wanting to borrow more (for investment) which increases the demand for money, putting upward pressure on interest rates. This results in the yield curve steepening as you can see in the graph below:
The Flat Yield Curve
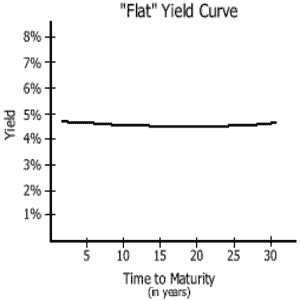
The yield curve is flat when yields of all maturities are close to one another. This happens when inflation expectations have decreased to the point where investors are demanding no premium for tying their money up for longer periods of time. Like with the inverted yield curve, when the yield curve moves from normal to flat, this is generally a sign of a pending, or ongoing economic slowdown.
The Humped Yield Curve
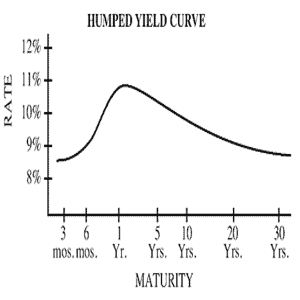
The yield curve is humped when short and long term rates are closer to each other than with medium term rates. This generally happens when there is either an increase in demand, or decrease in supply of longer term bonds. In recent years there has been a larger increase in demand for 30 year treasury bonds for example, than for 20 year treasury bonds, causing the yield curve for treasuries to often form a humped shape.
The Inverted Yield Curve
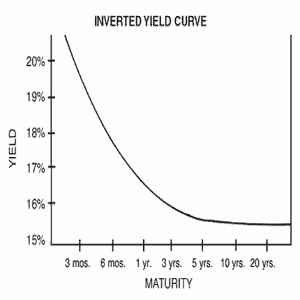
The yield curve inverts when longer term rates are actually lower than short term interest rates. This happens rarely, but when it does, it is one of the surest sings of an oncoming economic slowdown, as investors anticipate less future demand for money and therefore lower interest rates.
Trusted & Regulated Stock & CFD Brokers
What we like
- 0% Fees on Stocks
- 5000+ Stocks, ETFs and other Markets
- Accepts Paypal Deposits
Min Deposit
$200
Charge per Trade
Zero Commission on real stocks
64 traders signed up today
Visit Now67% of retail investor accounts lose money when trading CFDs with this provider. You should consider whether you can afford to take the high risk of losing your money.
Available Assets
- Total Number of Stocks & Shares5000+
- US Stocks
- German Stocks
- UK Stocks
- European
- ETF Stocks
- IPO
- Funds
- Bonds
- Options
- Futures
- CFDs
- Crypto
Charge per Trade
- FTSE 100 Zero Commission
- NASDAQ Zero Commission
- DAX Zero Commission
- Facebook Zero Commission
- Alphabet Zero Commission
- Tesla Zero Commission
- Apple Zero Commission
- Microsoft Zero Commission
Deposit Method
- Wire Transfer
- Credit Cards
- Bank Account
- Paypall
- Skrill
- Neteller
What we like
- Sign up today and get $5 free
- Fractals Available
- Paypal Available
Min Deposit
$0
Charge per Trade
$1 to $9 PCM
Visit Now
Investing in financial markets carries risk, you have the potential to lose your total investment.
Available Assets
- Total Number of Shares999
- US Stocks
- German Stocks
- UK Stocks
- European Stocks
- EFTs
- IPOs
- Funds
- Bonds
- Options
- Futures
- CFDs
- Crypto
Charge per Trade
- FTSE 100 $1 - $9 per month
- NASDAQ $1 - $9 per month
- DAX $1 - $9 per month
- Facebook $1 - $9 per month
- Alphabet $1 - $9 per month
- Telsa $1 - $9 per month
- Apple $1 - $9 per month
- Microsoft $1 - $9 per month
Deposit Method
- Wire Transfer
- Credit Cards
- Bank Account


